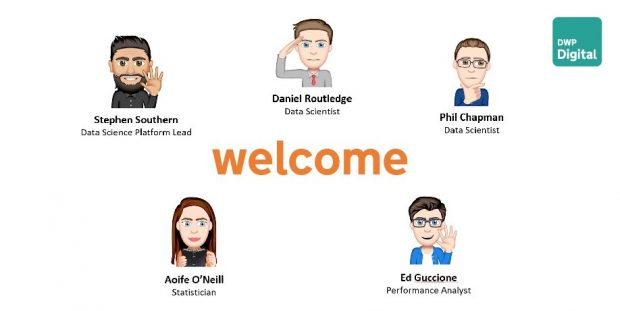
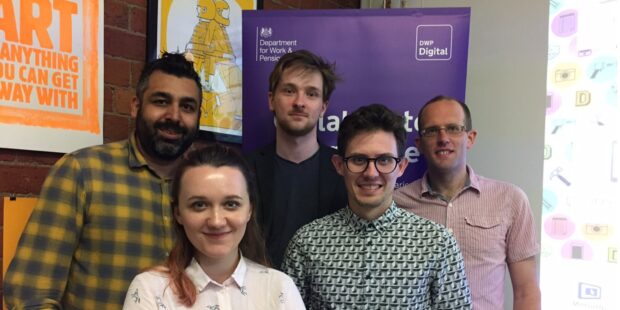
Last week we hosted a session as part of Leeds Digital Festival, which focused on how we’re using Data Science to innovate services at DWP. There was lots of interest in how we all came to work at DWP Digital, so we’ve written this blog post to share our stories.

Aoife O’Neill, Statistical Officer
At university I studied Zoology, where I was introduced to R Studio (open source data analysis software) for modelling ecological scenarios. During my degree I mostly used R Studio to conduct my analyses, which included modelling how birds’ reproductive rates and life span affect their population growth.
Once I graduated, I decided I wanted to pursue a career that would use the analytical skills I’d gained as part of my degree, so I joined the Government Statistical Service (GSS) as a temporary Statistical Officer.
I was offered a post at the Home Office working on crime statistics, an opportunity which I jumped at. A large part of the role was updating statistical bulletins, such as Hate Crime in England and Wales, which often have a very similar structure every publication cycle. I found myself wondering if parts of the process could be automated using R, but because of security concerns around using R on sensitive data sources I couldn’t begin to pursue this option.
After a year at the Home Office, I wanted to re-locate back to the north east. As lots of government departments have analytical hubs across the country I was thrilled that I could remain within the GSS and transfer my skills to another department.
I was posted to DWP Digital, where I joined the team responsible for DWP’s cross tabulation tool Stat Xplore. This allows users to create their own tables from our data, or call the data using an API. I was tasked with the job of using R to automate the production of official statistics. I was really happy to now have the opportunity to use my skills on automation, especially having experienced the fatigue of copying and pasting numbers from Excel to Word in previous roles.
However, I was quite nervous about how my skills in R would live up to the job, as previously I’d mostly used R for analysis, as opposed to presenting the results. I discussed this with my colleagues and was reassured that my best attempt was all that was needed and I embarked on learning about the wonderful package which is R Markdown.
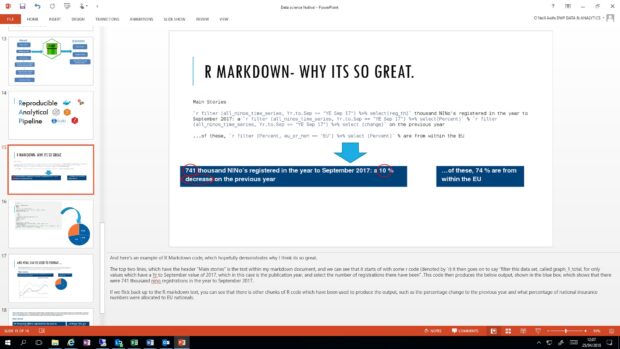
Within a matter of weeks I had managed to reproduce several of the publication’s graphs and much of the repeated commentary from the publication National Insurance Numbers Allocated to Overseas Nationals.
During my presentation at Leeds Digital Festival I showed some of the code which I used to replicate the publication’s commentary, and hopefully highlighted how easy it is to use R Markdown to generate automated commentary and graphs.

By producing publications using R Markdown, all a statistician has to do to update the publication is read in the latest data, and update the code to reflect the correct publication year. If an analyst wants to add any additional commentary, this can just be typed directly in to R Markdown. By using Data Science technologies such as R Markdown to produce our official statistics, we have the potential to reduce the time it takes to produce publications like this from weeks to a matter of minutes. We can also reduce the potential for human error.

Daniel Routledge, Data Scientist
In my presentation I spoke about analytical tools and techniques in Data Science. It was good to be back in Leeds and see the thriving data community, having picked up some of my data analysis skills while studying Physics at the University of Leeds.
The university now plays host to the LeedsDataSoc, a society connecting students from different disciplines across the university who have a common interest in data. It reflects how data is now reaching deeper into every industry and research area.
The skills in programming with Python and working with real experimental data I learned at Leeds continue to give me an opportunity to work in a huge range of digital roles. I was also lucky enough to study Computer Science in depth during my A-Levels, and a bit of Computer Science knowledge – either picked up from a wider STEM subject or by studying Computer Science itself – is a treasured skill in government.
Working in DWP Digital has given me a fantastic opportunity to broaden my range of skills. I’ve learnt new techniques and ways of working - from colleagues with backgrounds in academic mathematics; operational and social research; using data to inform policy; working with databases; website development and content design. There’s plenty of inspiration as to where to go next with my career!
Like Aoife, I joined the department through the GSS, which is one of the many routes into a digital job in government, bringing with it a good balance between flexible hours, location, pay, and career progression.
The GSS and the wider analytical community across government continues to grow digital skills, and DWP Digital is a place where those skills can go a long way. The ability to explore and handle safely anonymised data is allowing us to paint a clearer picture of the lives of vulnerable people in society. Data is a vital source of information for colleagues and ministers when making major policy decisions to try and improve the lives of those people, so it’s satisfying to be part of that and know my work can make a real difference.
With northern cities such as Leeds hosting events like the Digital Festival, and big organisations like DWP Digital recruiting and opening offices in the north, now is the perfect time to put your tech skills into practice, join the community and keep northern-cultivated talent local.
We’re hiring!
Over the next few weeks, we’ll be advertising for several data roles in DWP Digital. Keep an eye on our jobs site and our Twitter account for more information.
