
Hi, I’m Becky Lee, an interaction designer working on Get your State Pension in Newcastle. The service is currently in private beta so we’re inviting select users to use it as they approach State Pension age.

To find out how people are getting on with the service we’ve been using data analytics, user feedback and a hypothesis board. The process of using data analytics and feedback to inform service improvements is continuous. Here’s what we did:
1. Gather data and feedback
As soon as the first claims came through we started to collect a lot of data about people’s behaviour on the site as well as feedback from users. It’s really important to get as much data and feedback as you can about people’s behaviour and experience using the service.
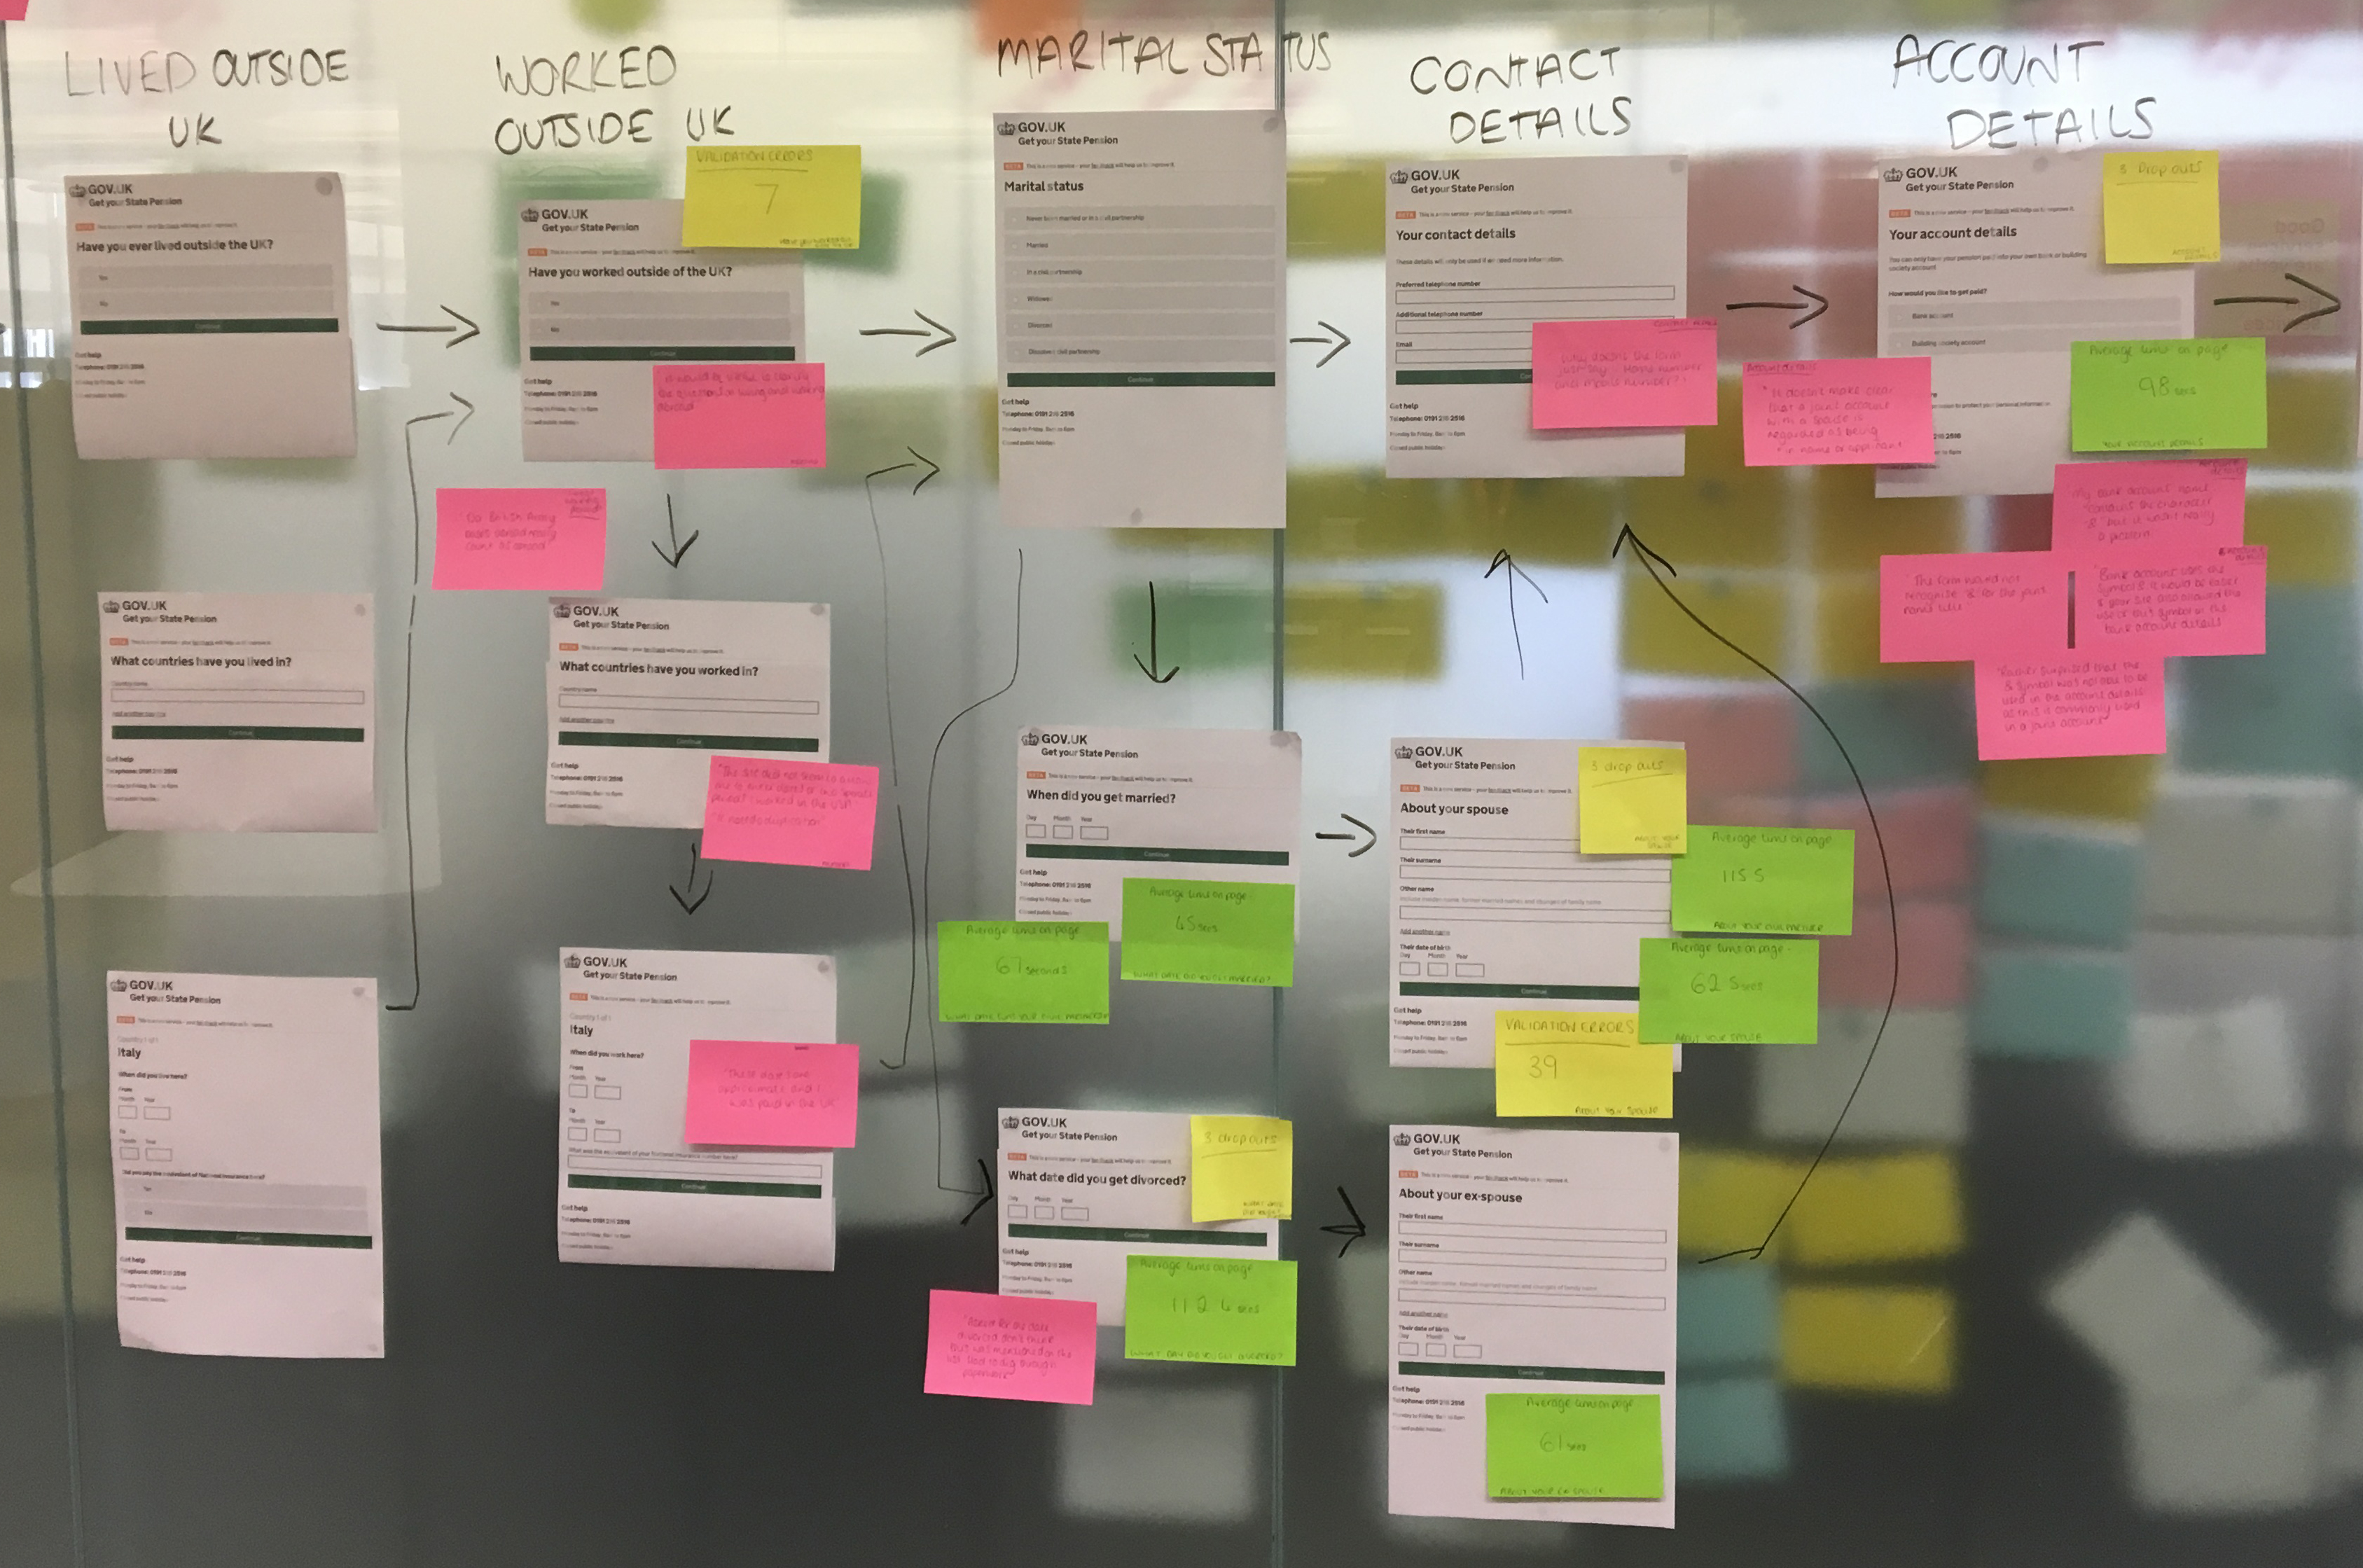
2. Map feedback to the user journey
To clearly see where the data and feedback corresponded to the service, we put some screenshots on the wall and stuck up post-its with key figures and quotes. We also thought about the emotions people might be feeling at different stages of the service.
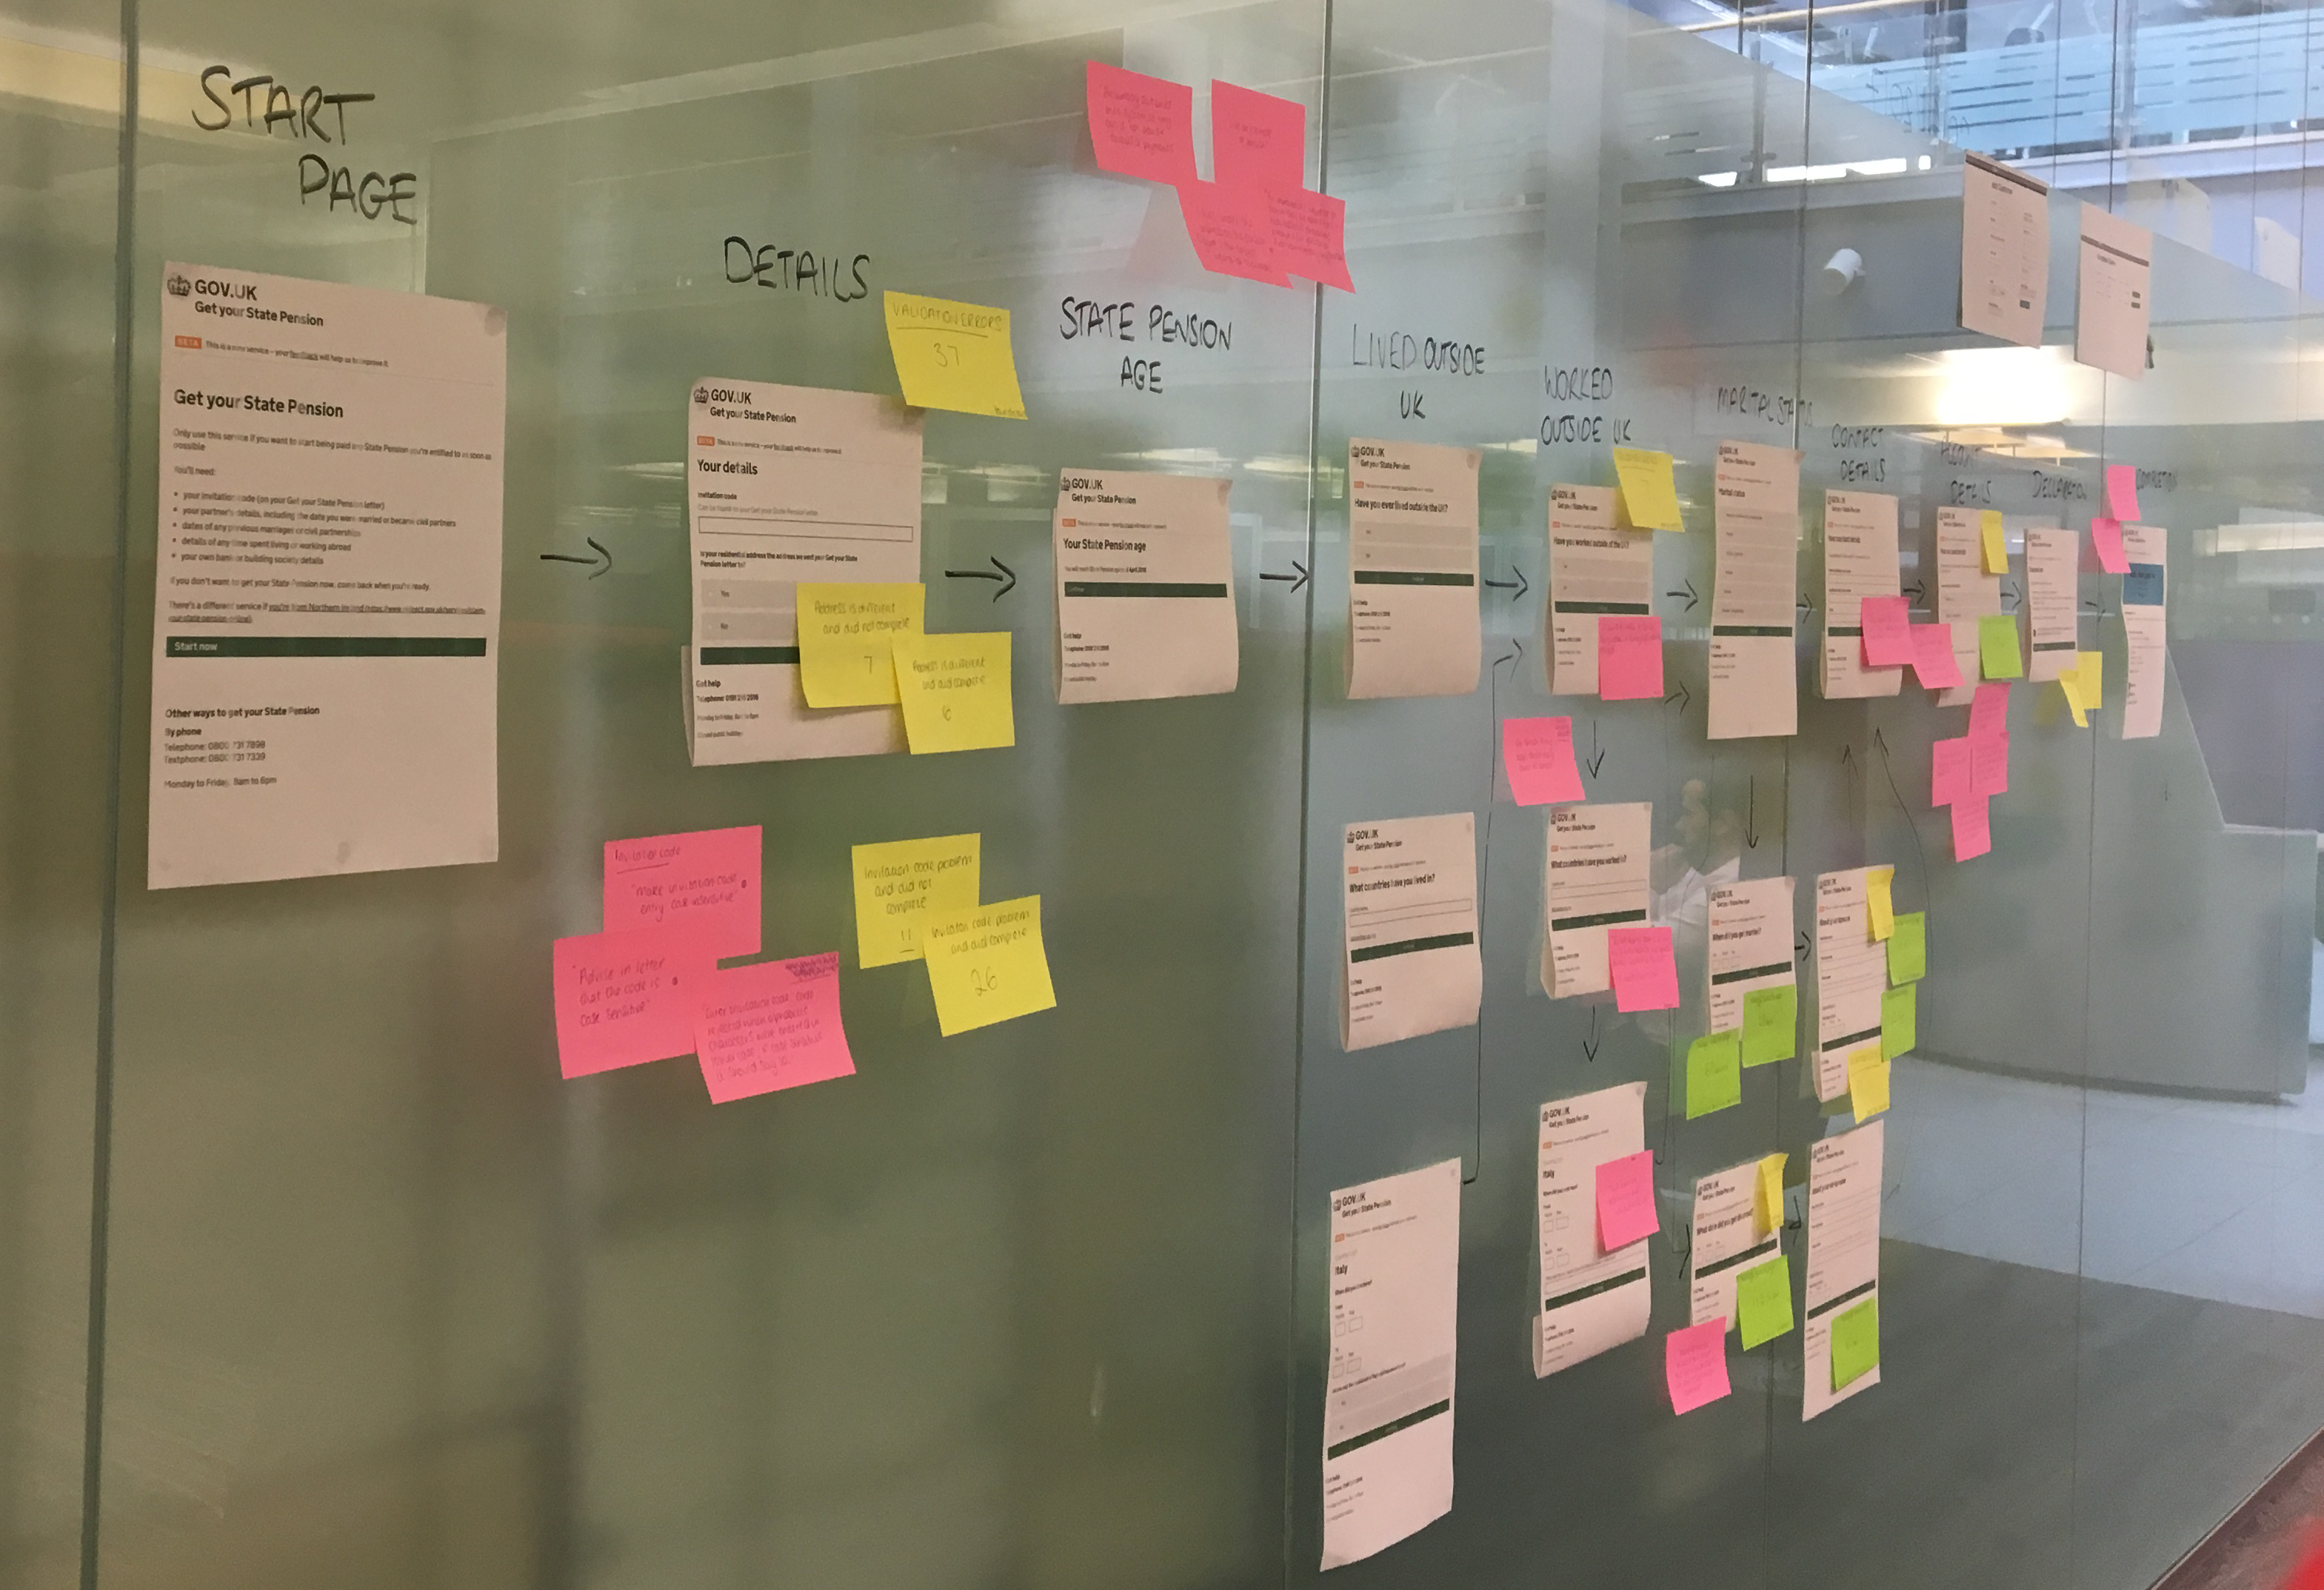
3. Identify issues and create hypotheses
Once everything is on the wall, it is easier to see areas where people might be having difficulty. For example, the data showed there were lots of validation errors being generated on the ‘Account name’ field. A bit of investigation into the user feedback showed that many people have joint bank accounts with ampersands in their account name and were unable to carry on through the service.
Our hypothesis was that by allowing the ampersand symbol to be accepted in this field, the validation errors would reduce significantly.
4. Test the hypotheses
After writing the user story and making the change in sprint, we went back to the analytics to see if there were any notable changes. In this case, the validation errors had significantly reduced. Users no longer had interrupted journeys at this stage, so there was no feedback - which in this case is good feedback. Therefore we proved our hypothesis correct.
Using data and feedback this way can really help all the team to identify the real issues that users might be facing using our service as well as inform current and future design. It doesn’t stop here though. The cycle continues as we monitor the feedback, create further hypotheses and test them. This will be especially important as we scale the service in the months to come.
3 comments
Comment by naomi bell posted on
Great blog demonstrating how we continuously improve the GySP service to meet user needs.
Comment by John Curry posted on
Great blog entry, Becky! My team used to sit near yours in block 9, and I always wondered (but never asked) how your team was using the visuals (screenshots/post-its etc) you mention above. Very interesting to read about 🙂
Comment by Dave Lyall posted on
Great Blog post, very interesting.
Dave Lyall
http://www.beedigital.co.uk