
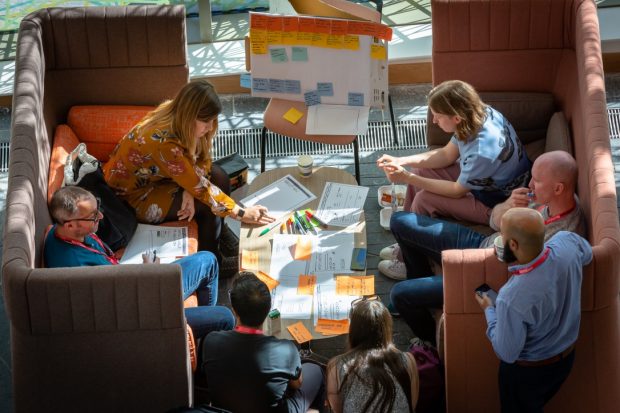
A few weeks ago I took part in the hack at the DataJam North East event in Newcastle.
The event aimed to bring the data and service design communities closer together and help solve problems affecting the North East region by holding both a hack (an intensive collaboration on a data or software project) and a free-form discussion called an unconference as part of the same event.

I’m not a data scientist or data analyst; I’m an interaction designer based in DWP Digital’s Manchester hub, but the hack at DataJam North East really appealed to me.
The organisers specifically wanted people from a non-technical, non-data background to join in with the hack to apply a design and user experience perspective. I thought it would be fascinating to see how data and design would work together in a hack environment.
Finding the problem and looking at the data
On day one I wasn’t sure what to expect, but after meeting the other members of my team, we started thinking about the question we’d been given to look at as part of the hack. Ours was:
‘What are the factors in the transition from Primary to Secondary school that influence the outcomes for children in the North East?’
I’m used to working in a user-centered environment so the first thing we did was to convert this question into a problem statement:
‘In the North East, pupils’ progress between primary and secondary attainment is lower than the national average.’
My main role was to work with the user researcher, think of ways to solve the problem and be the voice of the user. I also helped by putting together anything design-related such as user journeys and flows, concentrating on the users’ input and experience.
After extensive research and data sorting, we found that the problem statement wasn’t actually a big problem. The gap between exam results in the North East and the UK average was only around 3%. This took a lot of time, and it was disappointing to find that we had been working on something which ended up being a dead end. However, we were happy that we invalidated an assumption.
Changing our focus on day two
Instead of dwelling on this, we decided to turn it into a positive. We agreed that admitting that we couldn’t deliver anything because there was no user need, was better than presenting something which had no value. We decided to shift our focus.
During the research on the first day, we found that 30% of children in Newcastle live in poverty, compared to 20.1% in the rest of England. When this was surfaced we focused on an approach to this new problem which could potentially have a knock on effect on increasing children’s grades in the area.
Our final presentation included an analysis of the data, how this can affect school and grades, and also what other data we would need to tackle this further. We were really pleased with this outcome and it was good to focus on something which can be taken forward in the next few months.
Bringing data and design expertise together was worthwhile
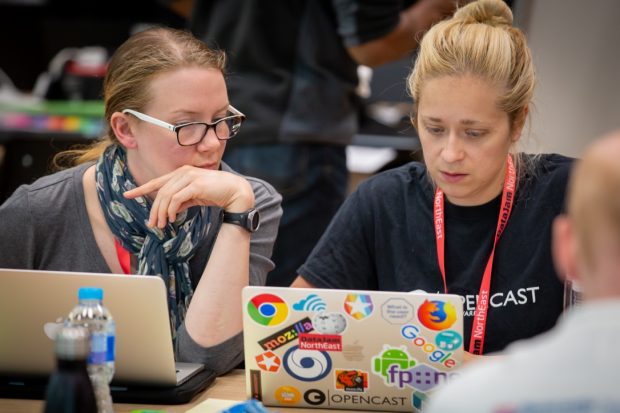
DataJam North East was a really interesting experience for me as a designer. I enjoyed working alongside data experts and seeing how they analyse and sort the vast amount of numbers. It was also interesting to be introduced to new data software, and experiencing first-hand how it can be used. Hopefully, the other people in my team valued my design input just as much as I valued their technical skills.
The main thing I’ll take away is that we proved that no matter what data you have available, starting off with a problem statement is invaluable. And it’s OK to find that a problem isn’t really a problem.
If we had continued with the initial problem statement we defined, then there would have been no solution. We may have come back with some answers after data analysis such as "The main factor in the transition from Primary to Secondary school that influence the outcomes for children in the North East, is that this area has a 10% higher poverty rate that the UK average". Without investigating the problem further, we would have been tackling the issue from a different angle which could have been incorrect, and therefore had a negative effect on children and parents in the North East - our potential users.
Starting with a problem statement allows you to really understand the problem, why it's a problem and who it affects. This means we design and build solutions that solve the right problems, in the right order. Changing the emphasis to a clear problem statement during the hack helped bring data and design closer together, highlighting that if the data is used incorrectly, it can have a great effect on the design and therefore the end user. But if used correctly like at DataJam North East, together they can make a difference.
If you want to get involved in the DataJam North East data and service design community email the DataJam team or search #DataJamNE on Twitter.
Watch a short video of the event with organisers and delegates talking about how DataJam North East brought data and service design together.
Recent Comments